Apart from a recent swoon spurred by fears that the U.S. Federal Reserve could raise rates, it was a summer of love for investment in emerging markets.
The MSCI Emerging Markets Index ended August up 15% for the year, after losing 20% in 2015. Compared with other rallies of recent years, much of the latest one has skirted China. Brazil (up 62% through Aug. 31), Taiwan (up 18%), South Africa (up 16%) and India (8%) – to cite four countries that have contributed to the rally – all have performed well, but each has performed well for different reasons.
The disparity highlights the differences among the 23 countries that constitute the MSCI Emerging Markets Index. To illustrate this phenomenon, we have examined the performance of each of the four countries cited above through the explanatory variables of countries, currencies and sectors.
The analysis examines the sources of performance within each country and expands on a view that institutional investors can access more conveniently thanks to MSCI’s interactive heat map, a new online tool that captures the daily performance for single country indexes within emerging, developed and frontier markets.
Viewing emerging markets through the lenses of currencies, countries and sectors
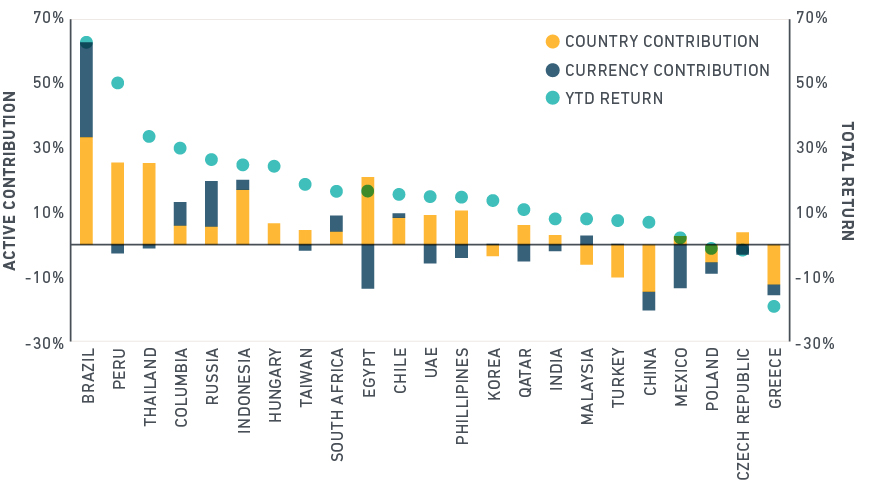
The country factor is historically the largest driver of return differences in emerging markets. 2016 is unfolding similarly. This factor captures political, regulatory and governance risk. The chart below shows that, through August, investors repriced sovereign risk in most emerging market countries. The contribution of the Brazilian country factor stands out in light of that nation’s tumultuous year politically.
COUNTRY AND CURRENCY FACTOR CONTRIBUTIONS TO EMERGING MARKET RETURNS
Second, the broad basket of emerging market currencies has appreciated against the dollar as U.S. interest rates have remained stable. Yet, as the exhibit above highlights, there’s disparity within the group. Two Asian currencies – the Chinese yuan and Taiwanese dollar -- have fallen relative to other emerging market currencies this year. However, in Brazil and South Africa, currency appreciation has rivaled the country component of return.
Finally, style and industry effects can be substantial, based on MSCI’s risk model, which contains factors tailored for emerging markets. The oil sensitivity factor is one and quantifies movements of oil prices for firms inside and outside the energy sector. Positive return to this factor represents a basket of stocks that tend to do well as oil prices rise.
The chart below shows the effects of oil and three export-related industries in Brazil, South Africa, Taiwan and India. Brazil’s economy reflects the price of oil and has benefited considerably from the rebound in crude prices. But financials (36%) and consumer staples (18%) each outweigh energy (13%) in MSCI’s Brazil Index.
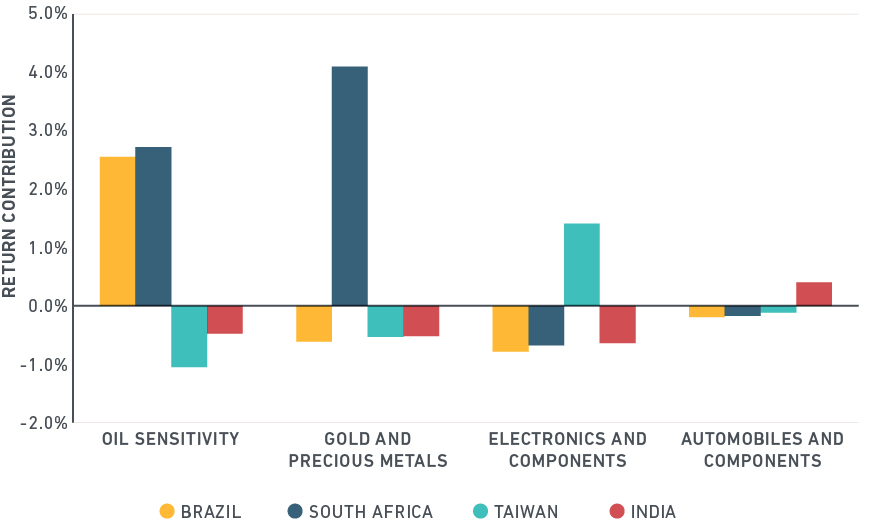
STYLE AND INDUSTRY FACTORS
Source: MSCI Research, based on data year-to-date, as of Aug. 31. The analysis uses MSCI’s Emerging Markets Risk Model (EMM1) to show returns relative to the MSCI Emerging Markets Index.
South Africa’s concentration in precious metals rewarded investors. But note the country’s sensitivity to oil prices: Sasol, an international energy firm, at 5% of the index, is the third-largest constituent.
Taiwan participated in the rally through its electronics industry, which constitutes nearly 60% of the sector weighting. India, which like China can represent a proxy for emerging markets in some portfolios, has not enjoyed the currency and commodity bump that Brazil and South Africa have. Still, India had tail winds from its automotive industry, which constitutes nearly 15% of the sector weights.
A broad-based emerging markets allocation has been effective in capturing the dramatic transformations of emerging economies over the last 20 years. But as a review of the performance of emerging markets this year highlights, countries that share characteristics can differ dramatically in drivers of return. The differences have offered opportunities for investors.
The author thanks Anil Rao for his assistance in preparing this note.